New housing supply (i.e., net housing deliveries) is the completion of new housing units, less demolished and newly uninhabitable units. A housing unit is any form of housing accommodation, such as an apartment, townhome, single-family home, condominium, or mobile home. Housing supply has two sources: 1) private construction, or non-governmental enterprises, which makes up 98.5% of new construction spending; and 2) public construction, or government funded construction, which is just 1.5% of construction spending. This White Paper will focus on private construction due to its prevalence as the primary source of new supply.
Housing supply is measured in two ways. The first, housing completions, are the number of housing units that are finished in a given period. While completions are a useful indicator of active construction activity, they are backward looking due to the length of time necessary to construct a single-family home or high-rise residential building, typically 6-24 months. The second, housing starts, are forward looking and represent the number of units that began construction during a given period.
The formation of a new household necessitates a vacant or newly constructed housing unit. Since the GFC, net new housing deliveries have not kept pace with household formation. Between 2010 and 2021 household formation exceeded net housing deliveries by nearly 4.8 million units. Each year during this period, more than 1.3 million new households were formed compared to 993,000 net housing units completed per year, on average, according to Kingbird Analysis of US Census Bureau Data. Without new units to move into, the remaining 332,000 households that formed annually have to move into already existing available inventory (i.e., the units that make up the current vacant supply). In 2008, approximately 4.5% of households with a head of household aged 25-34 years old, a proxy of new households, lived in a housing unit built in the past 3 years. This figure declined to 3.2% in 2020, according to Kingbird Analysis of ACS 1-Year IPUMS Data, driving US vacancy rates downward, as illustrated in Exhibits 2 and 3 below.
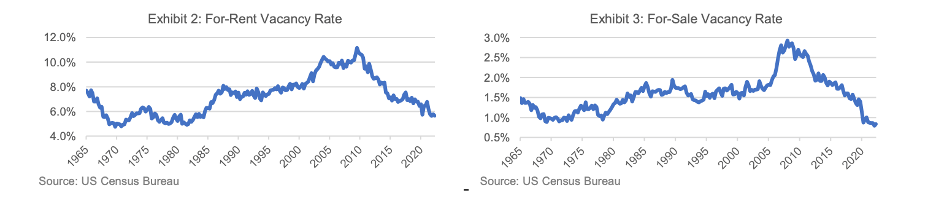
As of 2021, the combined vacancy rate in for-sale and for-rent housing was 2.5%, well below the estimated natural vacancy rate of 4.3%. 6 The 4.3% target vacancy rate for for-sale and for-rent housing is calculated as for-sale and for-rent housing’s historic average share of overall vacancy during periods when housing supply was greater than demand, multiplied by Freddie Mac’s target 13% overall vacancy rate. The target vacancy rate of 13% encompasses all housing unit categories: for-sale, for-rent, seasonal housing units, and vacant units that are being held off the market. A healthy housing market features ample supply of each of these types of categories in order to promote mobility and household formation. If the two categories of housing units besides for-sale and for-rent did not have ample supply, they would reduce the supply of for-sale and for rent units. The natural vacancy rate is the ideal rate to promote healthy pricing, mobility, and natural rates of household formation. If the national housing vacancy rate was closer to this 4.3% level, housing would also be more affordable for new households, people could move more easily, and households would likely form earlier and quicker. In short, a vacancy rate of 4.3% promotes a healthy housing market and facilitates various demographic trends. The for-sale and for-rent vacancy rate has been below this 4.3% target since Q2 2014.
In order to begin to address the nation’s housing shortfall, the vacancy rate must trend toward its natural level. At a minimum, 3.4 million units are needed to close the vacancy gap, while an additional 400,000 units are needed to maintain the target vacancy rate, given the enhanced household formation that would be spurred by more favorable housing conditions.
To close this gap within 5 years, while simultaneously meeting new demand, builders would have to accelerate the rate at which they deliver new units by approximately 71%. As previously outlined, only 993,000 units were delivered annually since 2010, but to close the housing gap the rate of delivery would need to be increased by 1.7 million units, to 2.6 million housing units annually.
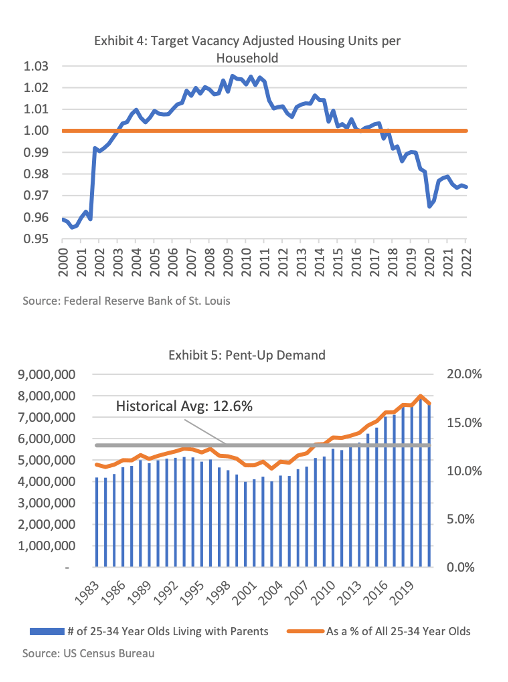
This lack of new supply can be easily visualized through the downward trend in the ratio of total housing inventory, adjusted for target vacancy, to the total number of households. Market equilibrium of this ratio is at 1, meaning there is at least one housing unit for every household, plus enough vacant units to maintain the target national vacancy rate. Exhibit 4 indicates this level is near historic lows and that the ratio has been below 1 since Q4 2017. The gap between the ratio’s current value of 0.97 vacancy-adjusted units per household and 1 approximates the 3.8-million-unit minimum housing shortfall.
The consequence of running below market equilibrium is not only a lack of housing units for new and existing households, but also that some households never form or do so significantly later than they would if there was adequate supply available. This is especially prevalent among younger generations. As shown in Exhibit 5, historically, 12.6% of 25– 34-year-olds have lived at home with their parents. This figure began to consistently rise in 2008 and was 17.0% as of 2021. As a result, the median age of household heads in the US increased from 49.0 in 2008 to 52.1 in 2021, according to Kingbird Analysis of US Census Bureau Data.
This increase in adult children living at home represents pent-up housing demand that will, upon release, further amplify the current housing shortfall. Given the unfilled housing supply backlog and pending demand, one would expect that supply would increase to meet it. However, while the number of housing starts in the US grew steadily coming out of the 2008/2009 Global Financial Crisis — from 586,900 in 2010 to 1.6 million in 2021 — the COVID-19 pandemic and its follow-on economic and labor market effects have palpably strained the residential construction sector. Housing starts appear to have peaked in April 2022, with 164,300 units started (a level last seen in 2006) and have since declined to 140,500 units in August 2022, according to Kingbird Analysis of US Census Bureau Data.


