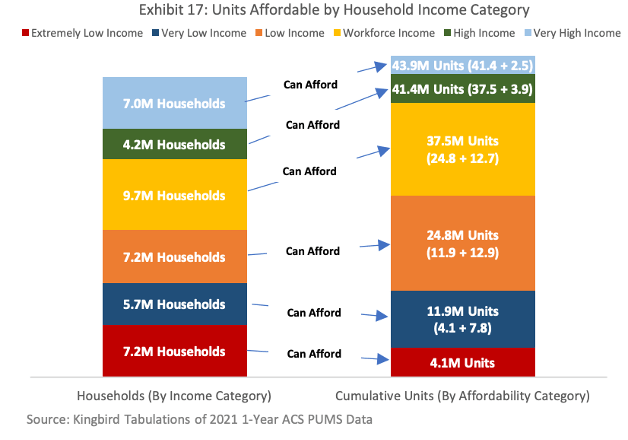
Among the groups most negatively affected by the housing gap is workforce households, those earning between $45,000 and $75,000 per year in household income. These households make up the largest group of renters, at 9.7 million, or 23.6% of total renter households, according to Kingbird Analysis of 2021 1-Year ACS PUMS Data. Despite this, the supply of housing affordable to this cohort is inadequate to their growing need.
 As new housing production has lagged household formation, rents were pushed to historic highs. This enhanced rent growth pushed renters out of apartments they could previously afford into lower rent units. This creates a “waterfall effect” in which renters at higher incomes push middle income renters into subpar housing product that consequently does not fit their lifestyle and needs. Simultaneously, lower income renters, who are often government supported, do not have the supply necessary to meet their cohort’s demand. This forces lower income renters into more expensive housing, further limiting the supply in the middle.
This waterfall effect continues both downward and upward through the market, eventually pushing workforce renters into sub-optimal and/or unaffordable housing product, as shown in Exhibit 17. Although there are ostensibly 37.5 million housing units in the US that are affordable to the 9.7 million workforce households, the limited relative supply at the higher and lower end of the product ranges limits the supply available to the workforce housing renter segment. Higher income renters are trickling downward into less expensive housing, while lower income renters are being forced upward due to the lack of adequate supply at the lower end. In this way, the waterfall effect inhibits the ability of workforce renters to supplant those in lower-tier units and limits the supply of workforce units available to actual workforce income renters; this narrows the band of units that are affordable and available to the nation’s largest renter cohort (accounting for 23.6% of renter households) from 37.5 million to 11.3 million, assuming a vacancy rate of 3.0% across all rental units. Note that over one-third of these units (34.8%) are of subpar quality relative to the rent pr ice category that corresponds to these households’ incomes.
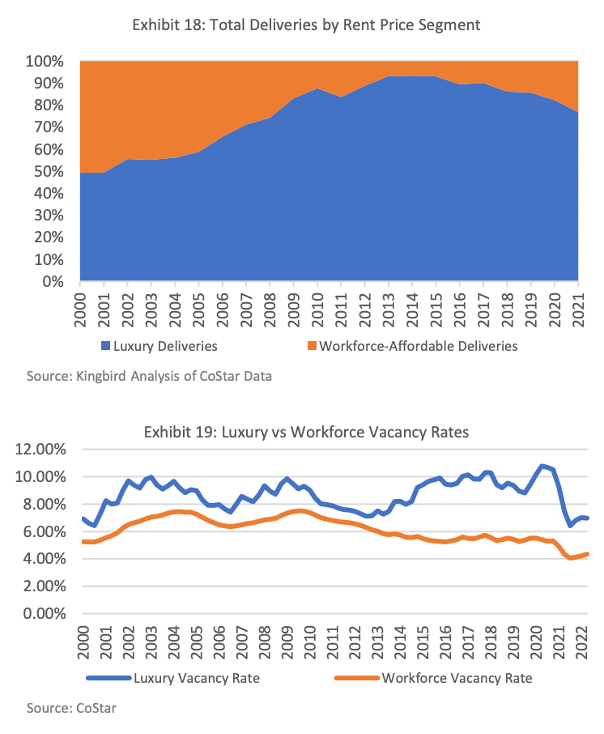
The workforce housing supply shortfall is worsened by builders’ recent preference for developing luxury product. In 2009, at the tail end of the Global Financial Crisis, the luxury share of new deliveries increased by 881bps, from 74.3% in to 83.1%, its largest jump, as shown in Exhibit 18. Specifically, since 2010, there were approximately 3.3 million apartment unit deliveries across the US, 2.9 million (87.0%) of which were luxury.
Only 432,000 (13.0%) were product affordable to workforce households, according to Kingbird Analysis of CoStar Data. This lack of supply relative to demand decreased workforce-affordable vacancies to historically low levels at 4.3% as of Q2 2022, per Exhibit 19. This is well below the luxury vacancy rate of 7.0%, according to Kingbird Analysis of CoStar Data. The result of this historically low vacancy rate is high rent growth. When vacancies are low, owners and managers can push rents on new and renewed units until they reach a rent level that optimizes revenue and vacancy.
Workforce apartments, given their low vacancy rate, have historically outpaced the rent growth of luxury units. Since the GFC, workforce rents grew at an average annual pace of 3.3%, compared to 3.2% for luxury rents, which is indicative of the asymmetric demand for lower quality product. Furthermore, workforce housing is resilient; during the 2020/2021 COVID-19 pandemic, luxury rents declined in three out of four quarters, while workforce rent growth remained positive, according to Kingbird Analysis of CoStar Data.
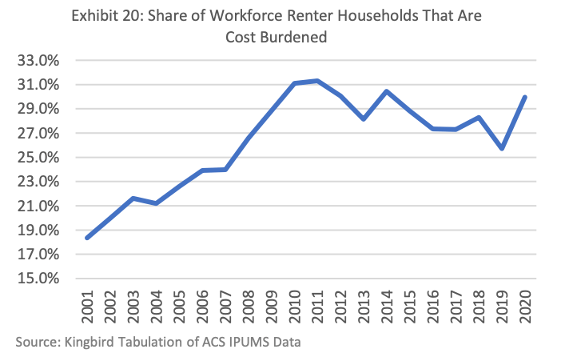
As depicted in Exhibit 20, this structural shortage in workforce housing resulted in a steady increase in the share of workforce households that are cost burdened (i.e., their monthly rent was greater than or equal to 30% of their monthly household income). This is due to rent increases instigated by forced migration into luxury buildings, as lower rent options become occupied or through rent growth at previously lower priced units. In 2001, 18.4% of workforce renters were cost burdened, but by 2020 this figure increased to 30.0%, with an average cost burden of 41.0% of household income, according to Kingbird Analysis of ACS IPUMS Data. This large and increasing share of cost-burdened workforce renters, coupled with the low vacancies and high rent growth exhibited by workforce apartments, signals the lack of choice for workforce households on all points of the rental price spectrum — affordable, workforce, and luxury.


